This guide has everything you need to know about sales reports. You’ll learn how to make them and how they help you close more clients from A-Z.
We’ll cover key metrics to look out for and even how to stay organized by using the right sales reporting tools.
If you’re running a business, chances are you’re selling…
This means your goal is for your prospect to buy your service or product.
Now, obviously, your average business owner or salesperson knows this but what’s missed are the NUMBERS.
That’s right.
It’s very difficult to have a masterful sales process if you don’t know your metrics — closing percentage, deal size, lead drop-off rate, just to name a few.
Without knowing these crucial numbers, you’re selling on blind faith.
Or you’re missing game-changing opportunities to land that next client.

So let’s walk through how sales reporting is your saving grace for more deals and revenue.
- What is sales reporting?
- Types of sales reports
- Metrics to include in sales reports
- How to make a sales report template
- The key to an easy sales report

VipeCloud is the only Automation tool your small business needs to
be the hero to your customers.
With Email, Texting, Social, Suites, Chat, Stories, Video Email & Sign Up Forms fully built-in, we provide you with the perfect platform to grow your business.
15 Day Free Trial – Get started risk free. No CC needed.
What Is Sales Reporting To Begin With?
Put simply, sales reporting or sales performance reports are metrics, data, and information that outlines the overall state of a sales process.
It’s a fantastic way of organizing key information such as:
- Number of leads
- Deals closed or won
- Closing percentage
- Revenue generated
(Just to name a few)

Sales reports are extremely important because they give you real data on what’s working and what’s not.
You get a birds-eye view of how your sales reps are performing, and how your sales funnel is performing throughout various timeframes.
This is big because you can predict revenue and forecast your profitability.
The key here is organization and transparency.
Without a solid sales report, albeit daily, month, quarterly or yearly:
You’re missing out on a slew of highly valuable information and opportunities to learn about your strengths and weaknesses.
Worst of all:
With a lack of sales analysis reporting, you might be unprofitable throughout a month or quarter without even knowing it.
So to avoid this, let’s go through the different types of sales reports.
Types Of Sales Reports
Not all sales reports are the same.
Different reports track different metrics, but they may also span different time periods.
Here are the different types of sales reporting you can use for analysis:
A Sales Funnel Report
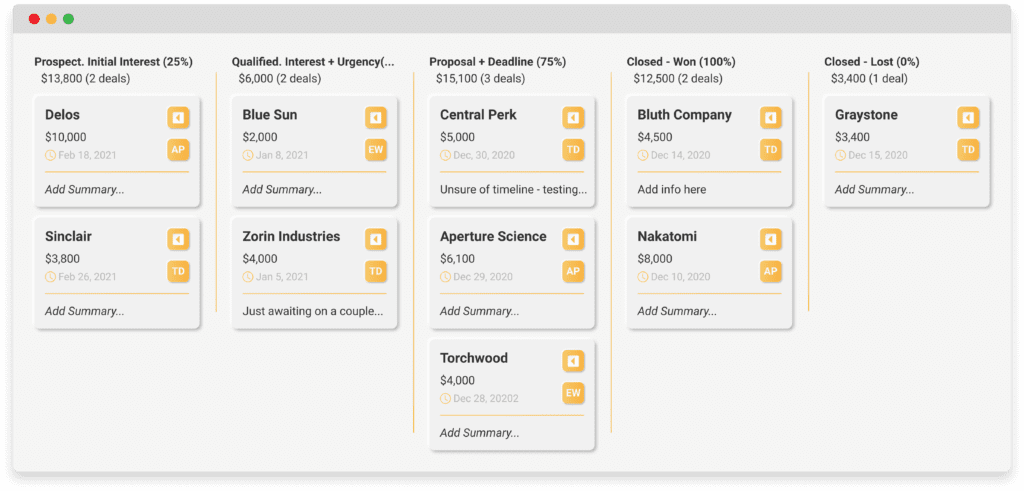
A sales funnel report shows you and your sales manager how close a lead is to purchase your product or service.
Sales funnels help you realize how to nurture leads and convert them into customers.
Simply compare your sales funnel reports back-to-back to identify weaknesses in your sales cycle.
An Opportunity Score Report
Opportunity score reports are a metric determined by artificial intelligence. It rates leads from 1 to 99 – higher scores suggest a higher likelihood of successful sales.
An opportunity score report is especially useful to divide your sales team’s time and effort pursuing leads.
A Daily Sales Report
As the name suggests, this type of sales report displays the results of your sales for the day.
Daily reports wouldn’t be your go-to for predicting your sales revenue in the future.
They’re more suited for keeping you or your sales reps accountable and vigilant on closing deals, making them perfect for tracking productivity.
That’s right…
No slacking off here.
But it’s also vital to remember to give good daily words of encouragement to keep your team motivated, no matter what the daily numbers look like. This keeps the morale up and pushes them to keep going!
A Weekly Sales Report
Weekly sales reports are your 7-day performance reports.
Here, we are a step above daily reporting and are gearing more towards monthly predictability.
Make sure your weeks are solid so that your month reflects it.
And speaking of months….that’s our next one:
A Monthly Sales Report
Monthly sales reports are some of the most widely used forms of reporting. These, of course, give you sales data across a 30-day timeframe.
Here you can track and get an idea of your rockstar months and your not-so-pretty months. Depending on your industry, your “good” months could vary.
Let’s list some important metrics to keep top-of-mind for monthly sales reports:
- Deals won closed
- Revenue for the month
- Leads generated
- Emails sent
- Cold calls
- Meetings booked
- Sales meetings
Monthly reports are a great tool for sales managers to also gain feedback and become even better decision-makers long-term.
For example, If your last 2 months were lower in revenue than usual, you’ll need to read the data and figure out why.
Think:
Is it a volume of leads problem?
Are your sales meetings lack-luster?
Are my sales reps dozing off during calls?
From there, you would need to make improvements, or else low revenue months will only continue.
Monthly reports are a great tool for sales managers to also gain feedback and become even better decision-makers long-term.
Better decisions = better results.
It all connects.
An Annual Sales Report
The annual or yearly sales report is your last 12 months of selling. What’s so great about annual reporting is that it gives you important seasonal trends.
You also get feedback on what kind of results came from your decision-making.
Maybe you’re a higher-up and decided that your company ought to start working with a new marketing agency.
Let’s say this happens, and they end up bringing 5x more leads…
Which eventually trickles down into more revenue for the second half of the year.
This would be an example of decision-making being reflected on the annual report.
It’s important for CEOs, CMOs, sales managers, and higher-ups to look at annual reports because they also help highlight reps with great numbers. (Be sure to reward them for a job well done!)
Sales Forecasts
Another thing — which I highlighted earlier, was forecasting your revenue.
A sales forecast report basically predicts sales activities on a daily, weekly, or monthly period and is usually based on previous sales reports.
A sales forecast can help you and your sales team to anticipate seasonal slowdowns and find solutions to issues that might affect your business.
Upsell and Cross-sell Reports
Upsell and cross-sell sales reports reveal the number and value of items your sales team has upsold or cross-sold to customers.
Your sales team can take a look at these reports to identify the upselling and cross-selling opportunities for the future.
Your team can also find these types of sales metrics to flag certain products and services as especially suited for upsells and cross-sells.
Valuable Metrics In Sales Reports
Before we hop into how to make a report, let’s explore further the actual metrics that will be important to you.

Let’s start with deal size.
Depending on your industry & services, your deals may come in different price sizes.
Deal size helps you see which of your prospects, if closed, would bring you the most revenue. With this in mind, you can take measures to make sure those deals close.
Now, this is just one of the many big KPIs to look for.
Some other relevant sales KPIs will likely be:
– Number of leads
– Number of sales calls
– Number of closed deals
– Closing percentages
– Revenue generated
– Touch-points

These are some of the strongest key performance indicators that will keep your sales process on the right track.
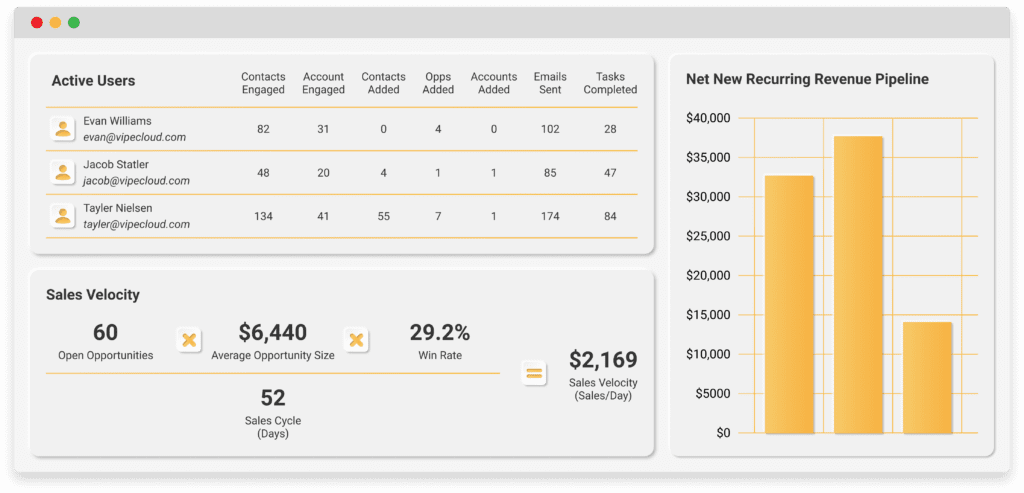
If you have sales reps, it’s a pretty good idea to isolate their performances so you can get a good idea about how each rep is performing.
You instantly know who is staying on top of their sales targets, which is another valuable metric.
For example, maybe reps are to close at least $25,000 a month in deals — that would be a sales target KPI.
Okay, these next few metrics may be a bit underrated. Higher-ups should definitely know these numbers:
- Client Acquisition cost – How much it costs to close a client
- Customer Lifetime Value (CLV) – The net-profit of the future cash-flow a customer will bring to your business
- Customer churn rate – The rate at which customers stop working with you. (Keep this as low as possible by setting the right expectations and going above and beyond when you can.)
Now that you’re all trained up on what valuable metrics to look for, let’s dive into making the report itself.
How To Make An Awesome Sales Report Template
With all the cool tech we have nowadays, making a clean and professional sales report is quite simple.
You could always start from scratch using a spreadsheet, but there are countless templates and CRMs that make things easier and save you time.
Outlining Your Report
First, make a note of the specific metrics you want to track in your sales report.
KPIs like leads, profit, net sales, deals closed or won, etc.
Also, figure out what kind of timeframe you want to track, daily, weekly, monthly, annual, etc.
Know the purpose of this report so that you aren’t mentioning irrelevant information. When irrelevant information is added to a sales report, it may confuse everyone.
What’s Included
Put together your data and make sure it’s as accurate as possible. If you’re using software to make your report, you’re less likely to run into any hiccups.
Graphs and charts are also vital in order to make your report more visually appealing.
This is also important because people have different learning styles. The CMO of your company may prefer a graph over strictly numbers on a page.
Pro Tip: Be sure to also compare your report to previous time frames of the same length. This is a great way to show progress in your company’s sales process.
Remember that context is also important.
If you know business always picks up in November, then you wouldn’t want to compare it to a slow month too much, like perhaps March.
A good sales analyst is aware of certain intangibles that the data won’t pick up on.
Now let me tell you what to avoid on your report.
Avoid “vanity metrics” that are unimportant, like social media likes on a lead generation Facebook ad, for example. In this situation, the important KPI would be leads, not likes.
Next, using the data, forecast the sales efforts for the next time frame. You can include this in the summary, which is our next topic.
Forecasting is huge because it’s like a compass that steers you in the right direction long-term.
The Summary
This will be what wraps up your report.
Some may prefer to have this in the beginning, but, well, it’s really up to you.
You will detail the important parts of your report and mention why they’re significant. You can mention good things about what’s reported and also the ugly.
Your summary should be concise and not too lengthy.
The reason for this is because some of your colleagues may not want to read a super long essay.
The summary is important because it’s more likely to be remembered than the numbers on the report.
Again, there are many templates you can use to generate these reports.
We recommend you utilize a CRM.

Organizing Your Sales Reporting: The Power Of A CRM
The power of a CRM can’t be beaten.
A Customer Relationship Manager or CRM is a platform where you can nurture, manage and keep your prospects in your loop. It’s very important, especially if you have long sales cycles in the B2B space.
Put simply, using the right CRM software is convenient, faster, scalable, and less manual work compared to a spreadsheet or template.
You can get your reports just by using the dashboard.
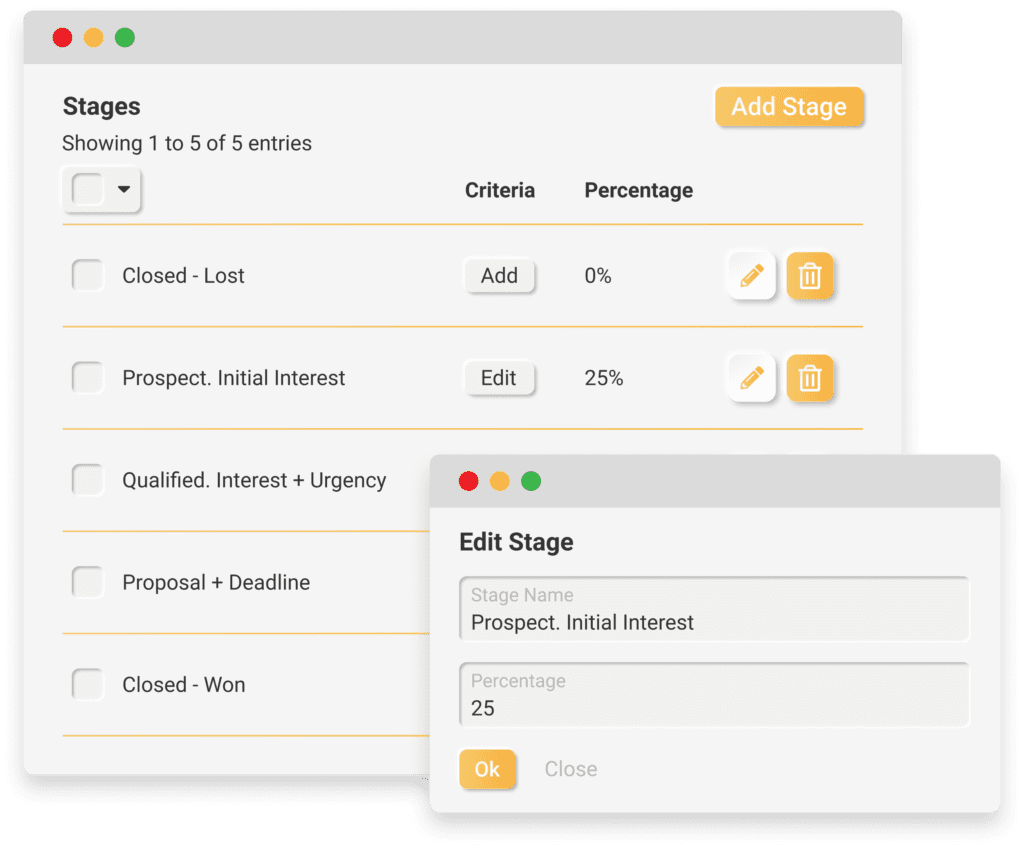
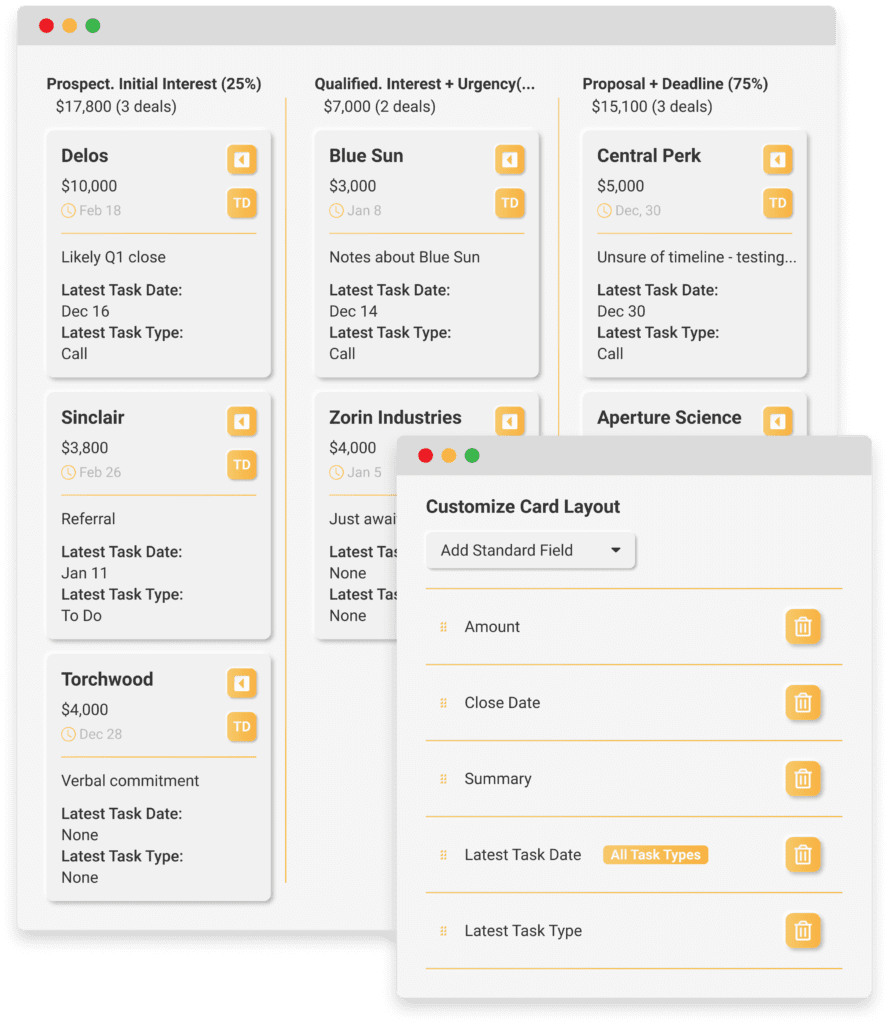
VipeCloud’s Sales CRM is the perfect start if you want to make professional sales reports without the hassle.
You’ll stay on top of where your prospects are on your funnel and get the accurate data needed. (Our Sales CRM is also free for your first 15-days.)
Without a CRM, getting disorganized is, unfortunately, more likely to occur due to the many moving parts of the sales process.
There are countless stories out there of prospects “disappearing” because there wasn’t a streamlined process to reach out.
But most importantly:
Businesses that leverage CRM software see sales increase by 29%, sales productivity increase by 34%, and sales forecast accuracy increase by 42%.
Imagine that for your business!
Using Sales Reports To Make Improvements
Reading and learning from sales data is such an important step in creating a phenomenal sales process.
Whether it’s you or your reps selling, let the numbers tell you where to make improvements.
A big trap that sales reps fall into is letting their ego get into the way of learning. Remind them and yourself, that improvement is the true commitment.
Yes, as stated earlier, some months will be better than others. Some variables may even be out of your team’s control.
What remains the same should be improved.
Oftentimes you’ll see managers offer a good extra stipend if sales reps reach a certain monthly revenue.
In an indirect way, the sales rep is likely to improve because they’re motivated by the gold at the end of the tunnel.
This would probably be a good idea to try out if you find some reps lagging behind.
Knowing Your Sales Data Intangibles
I briefly mentioned earlier some intangible events that won’t show up in the sales metrics.
It’s your job to draw conclusions from within your business if certain numbers look inflated or even low.
So let’s say two of your sales guys got sick for 2 weeks.
If your number of monthly meetings goes from 45 to 23, you could conclude that the two guys being out, lessened your amount of conversations. Which also lessens your number of meetings for the month.
In the sales summary, you could mention this and propose a system that handles events like this.
So that in the long-term:
Your process is almost immune to sales reps getting sick, or similar situations.
In this scenario, you can clearly see the lasting positive effects of sales reporting and sales analysis.
No-brainer, am I right?
Sales Reporting: Your Key To Higher Revenue
Sales Reporting is the backbone to selling that gets better over time.
You go from juice to fine wine.
It’s important to get clear on the KPI’s you need, the timeframe, and the purpose of your report. Forecast your efforts and make sure your team is learning from the data consistently.
Over time — your company becomes a well-oiled machine.
The reason for this is simply the fact that sales reporting keeps everything transparent, which takes the confusion out of your business systems.
You’ll find your business landing even more deals, possibly 5x more.
Your competitors don’t stand a chance against you when you’re able to leverage sales reporting along with a good CRM.
VipeCloud’s Sales CRM is your best bet for efficient and top-of-the-line sales reporting. Let’s get you on the right track to more revenue by leveraging our software for your business.
Start your 15-day FREE trial by clicking here.


Leave a Comment