Last updated on October 30th, 2023

Today you’ll learn the ins and outs of CRM dashboards to better track sales, marketing, and customer activity.
CRM dashboards contain information and KPIs to help sales reps, marketers, and leaders understand the direction of their operations.
A lot of the time, small businesses will use a CRM spreadsheet to keep track of their most important contacts.
But this is simply not the best way, especially as a business expands.
Table of contents:
- What Are CRM Dashboards, And How Do They Work?
- What Are The Benefits Of CRM Dashboards?
- What Should Be On A CRM Dashboard?
- What To Consider When Creating Your CRM Dashboard
- How Do I Create A CRM Dashboard?
- A Final Overview Of CRM Dashboards
 Automate All Your Communications With VipeCloud
VipeCloud is the only Automation tool your small business needs to
be the hero to your customers.
With Email, Texting, Social, Suites, Chat, Stories, Video Email & Sign Up Forms fully built-in, we provide you with the perfect platform to grow your business.
15 Day Free Trial – Get started risk free. No CC needed.
What Are CRM Dashboards, And How Do They Work?
A customer relationship management (CRM) dashboard is a hub containing data on sales, customers, and marketing activity.
It differs from traditional “static” CRM reports since it provides real-time operational updates.
Sales managers, account executives, and marketing heads can see live activities and their results at a glance.
They can make improvements with the insights found or continue with what’s working.
For example, if an account executive is getting plenty of opportunities but isn’t converting them into wins.
A sales manager can use the insights from their activity to coach them on improving lower-funnel selling.
This could mean increasing their touchpoints or changing how they position the product during sales calls.
CRM reporting dashboards also help marketing managers track campaign results to pinpoint lead quality and conversion rates.
CRM dashboards are about simplicity — so visual graphics, color-coded sections, and numbers help keep reporting clear.
Here are roles that benefit from CRM dashboards and how they go about it:
- Executives – CEOs and founders can track the company’s overall health by keeping up with KPIs from major departments.
- Marketing leaders – Marketing managers and agencies can track top-of-funnel activity to ensure marketing activities bring in leads.
- Sales directors and managers – Sales leaders can gain insights on rep performance and compare who’s excelling in what. Improvement takeaways can be added to the sales playbook.
- Account executives – Reps can track their numbers to ensure they’re productive enough to reach their quotas.
- Business Development Reps – BDRs/SDRs can ensure they’re having enough email, text, and phone conversations to have enough leads and discovery calls in the pipeline.
What Are The Benefits Of CRM Dashboards?
1. Improved Sales Cycle Insights
Sales dashboard software keeps your numbers transparent, especially with your pipeline.
Pipelines let you better see which opportunities reps should prioritize based on size.
And sales managers can track customer-facing reps’ daily, weekly, and monthly activities to pinpoint if there’s enough sales cadence or too much.
CRM dashboard insights also give “sales velocity” insights that tracks how fast the organization is closing deals.
2. Systemized Department Communication
CRM dashboards convey cross-department information, saving time from manually inquiring about deals.
In other words, instead of email communication from a CEO to a director of sales about how deals are going, they can both see these numbers from their CRM.
This has value for small businesses since founders usually wear many hats.
With a small team, your dashboard can quickly show all activities, so your team can stay on track with goals.
3. Activity Updates In Real-Time
CRM dashboards are dynamic, meaning recent changes in business and customer interactions get recorded in real-time.
Dynamic updates lead to quicker decision-making than daily or weekly printed statistic reports.
Real-time updates are especially valuable if you have hundreds of deals in your pipeline and need constant activity management.
4. Improved Decision–making From Leaders
Business leaders can make more informed decisions thanks to CRM dashboards.
Whether it’s changing your marketing angle to attract higher quality leads or increasing the value of your product to match revenue goals and the value it offers to a marketplace.
The information present removes the guesswork about the company and does so from a daily, weekly, monthly, and quarterly standpoint.
What Should Be On A CRM Dashboard?
Here are features that your CRM dashboard can’t miss out on.
Sales Rep Activity
Your CRM dashboard should track what reps are doing day to day and month to month.
This can include:
- How many calls, texts, and emails they’re sending
- How many contacts they’ve engaged with
- Latest tasks they’ve completed
- Number of deals closed
- Sales revenue
- Win-rate
It’s essential to have the right sales KPIs tracked so that your team is focused on what moves deals forward the most.
Also, some KPIs should have priority over others.
For example, “contacts engaged” is an important metric, but your win rate and the number of deals closed is the ultimate decider of sales success.
Your valuable contacts (i.e., those with high lead scores) hold the most value when being contacted.
So yes, it’s great if a rep has reached out to many contacts, but if win rates are low, perhaps the type of contact (segment) to focus on could be narrowed.
Opportunities By Stage

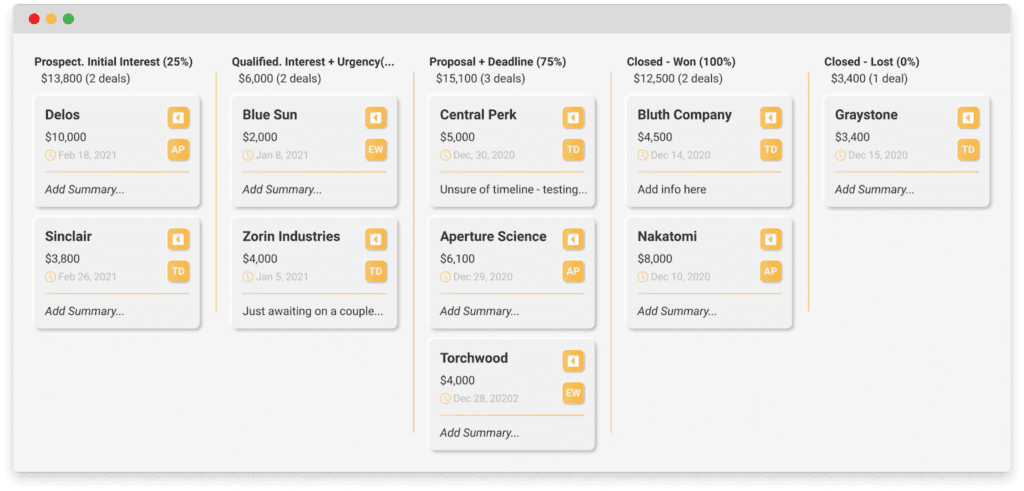
Opportunities outline all the activity occurring in your sales pipeline.
With VipeCloud, you can edit what data is shown on your opportunities pipeline so that sales leaders only see the most critical data at a glance.
For instance, you can elect to show the value of each deal, the summary, and the latest task type.
Sales Velocity
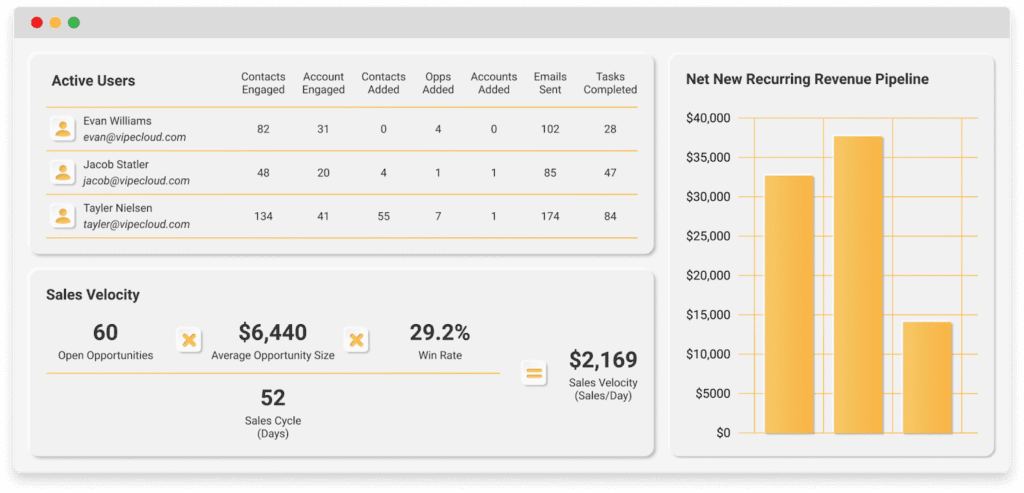
Sales velocity is popular among sales dashboard software, and it tracks how quickly you’re closing deals in the sales cycle.
CSO Insights found that 74.6% of B2B deals in general take at least 4 months to close.
Looking into your industry and comparing your sales cycle length helps pinpoint how well you measure up to the average.
Remember that the likelihood of winning deals increases when your sales cycle is shorter, and it benefits velocity.
VipeCloud’s CRM dashboard “Reports” helps track sales velocity to ensure you’re bringing in more revenue in less time.
The less time it takes for deals to close, the more time there is for your reps to go after new deals based on your lead distribution model.
Here’s how sales velocity gets calculated:

Revenue Metrics And Forecasting
Your sales dashboard should contain the revenue you’re generating and the potential revenue the company could make.
Potential revenue, or “forecasted” revenue, shows potential deals which can be broken down individually.
There should also be a feature that lets you break down forecasted revenue by sales rep.
Task By Type
Task management ensures team members get notified on what to do and that managers know completed action items.
“Task by type” is a metric tracking how many tasks reps have completed to maintain productivity.

If a user isn’t completing as many tasks, sales leaders can identify it as a coaching opportunity.
What to Consider When Creating Your CRM Dashboard
Before you jump into crafting your CRM dashboard, there are some key considerations to keep in mind.
Prioritize Your KPIs
Too many KPIs can overwhelm your team and dilute focus. Prioritizing a few key metrics ensures everyone knows what’s crucial for success.
So, conduct a team meeting to identify the KPIs that directly impact your sales and marketing goals. Focus on the ones that give your team the most actionable insights, like follow-up contact rates or average sales pipeline duration.
Align With Sales Goals
Aligning your dashboard with your sales goals is essential for effective decision-making and strategy execution.
To make sure your dashboard serves this purpose, map out your key business objectives. Then identify the metrics that directly contribute to those goals.
For example, if inbound lead generation through social media is your priority, displaying engagement metrics or conversion rates on your dashboard would make sense for you.
Keep It Simple
A cluttered dashboard is a confusing dashboard, leading to analysis paralysis.
And a clean, straightforward design ensures quick decision-making.
To achieve this, use a minimalist design approach. Limit the color scheme to about three colors and use white space effectively to separate different data points.
Design Intuitively
Time spent deciphering a complicated dashboard is time not spent on revenue-generating activities. That’s why a user-friendly design is essential.
Use intuitive layouts and simple navigation to make the dashboard easily understandable. And before rolling it out to everyone, test it with a few team members to ensure it meets this criterion.
Keep Improving
Business needs and team dynamics are always changing, so your dashboard should be flexible enough to adapt.
Schedule quarterly reviews of the dashboard’s effectiveness and collect feedback from team members. Make adjustments as needed to keep it aligned with evolving business goals.
How Do I Create A CRM Dashboard?
Below are 3 steps to create a CRM dashboard.
1. Start With VipeCloud
Versatile CRMs offer reporting dashboards for your significant departments. Their value also extends to the marketing, sales, and customer service tools.
Once you’ve implemented the right CRM, you have to break down how your current processes are going.
Starting with VipeCloud will give you access to a dashboard that covers the crucial features to look for.
2. Examine Your Processes (Sales, Marketing, and Customer Service)
When examining your processes to make improvements, you can use a SWOT analysis.
SWOT stands for:
- Strengths – Where is your process excelling? What’s already being tracked and working?
- Weaknesses – What could be improved? What KPIs and activities are going unnoticed? (Maybe it’s email activity or the number of completed tasks they’re doing.)
- Opportunities – Which external factors could benefit your process? (Perhaps a robust CRM dashboard or one that makes reporting simpler than your current one.)
- Threats – What are internal or external factors that could harm your organization? (Perhaps the weakness of poor reporting can lead to revenue leaks over time)
The job of your CRM dashboard is to report more simply.
Your SWOT analysis will help your dashboard implementation by helping identify features and advantages your company is deficient in.
Here are questions you can ask when first implementing or changing how you implement a CRM dashboard.
- What KPIs do I want to track?
- What are sales or marketing reporting gaps present?
- What’s not working, and what is working?
- What is my sales velocity, and what is it saying about my sales process?
- Is my sales cycle faster or at least up to par with my industry average?
3. Use VipeCloud’s Reports Feature
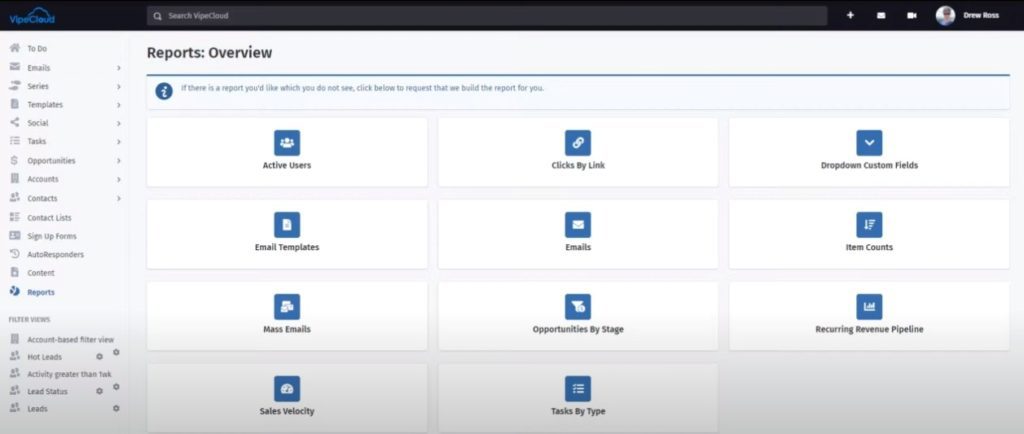
Log into VipeCloud and navigate to the “Reports” feature.
This is where you’ll be able to see company activity.
Inside, VipeCloud gives you a CRM dashboard template, meaning it already lists and tracks important activity and KPIs.
How To Navigate VipeCloud’s CRM Reports Dashboard

Below are prime features in VipeCloud’s Reporting dashboard. You can find these by navigating to “Reporting” on the sidebar of the CRM interface.
- Active Users – An overview of system utilization from team members (contacts engaged, accounts engaged, contacts added, accounts added, emails sent, tasks completed.)
- Opportunities By Stage – A birds-eye view of your whole team and how many opportunities each person has in what stage. This is broken down by the number of opportunities and their combined dollar value. You can switch between multiple pipelines to see opportunities in each pipeline. You can also edit cards to display primary contacts, the value of the deal, the last contact date, and more.
- Email activity – This is a synopsis of email activity across your sales team. It adds up the number of emails sent and the number of opens, clicks, and replies produced by each seat member. Also ideal for tracking email marketing campaigns.
- Sales Velocity – Covering how fast deals are closing, VipeCloud lets you break sales velocity down by pipeline and user.
- Task By Type – Showing tasks completed. This is useful for customer service, sales, and marketing departments. You can also add custom task types (for example, text messaging.
- Item Counts – This counts how many contacts, accounts, opportunities, open tasks, and completed tasks each user has as to their account.
- Recurring Revenue Pipeline – Helps forecast revenue for products and services with a monthly cost. It’s a beneficial use case for SaaS companies, marketing agencies, and businesses that operate on monthly retainers.
A Final Overview Of CRM Dashboards
CRM dashboards track the revenue-generating activities across different departments.
It’s a single source of truth, and improves decision-making, systemizes communication, gives clear insights, and brings real-time information.
VipeCloud’s Reports is a CRM dashboard that gives you a birds-eye overview of your sales efforts, marketing campaigns, and customer activity.
It’s inside VipeCloud’s Sales and Marketing Suite, which is that same CRM that has tools like:
If you’d like to hear of CRM dashboard use-cases for your industry, feel free to request a demo, where you’ll speak to an expert.
If you’re ready to try VipeCloud’s Reports feature in the Sales and Marketing Suite, try it for 15 free days!
Sources:
- Things to consider when creating a CRM dashboard: https://www.businessnewsdaily.com/16069-crm-dashboard.html
- FAQs:
- What does CRM show? https://www.salesforce.com/eu/learning-centre/crm/crm-systems/#:~:text=A%20CRM%20system%20helps%20businesses,Customer%20Lifetime%20Value%20(CLV).
- What is a key benefit of using a CRM dashboard? https://stampede.ai/blog/crm-dashboard-definition-and-benefits-for-the-hospitality-industry
- What is the best practice of CRM dashboard? https://www.netsuite.com/portal/resource/articles/crm/crm-dashboard.shtml#:~:text=A%20CRM%20dashboard%20best%20practice,KPIs%20used%20to%20measure%20them.

Leave a Reply