
This guide uncovers how to track sales activity with and without spreadsheets. By the end, you’ll know how to efficiently track your sales KPIs with the best tools.
Sales tracking is the ongoing process of following sales performance.
It keeps the results of your sales process clear, helping you avoid revenue loss and pivot your strategy based on data.
Many SMBs track sales using spreadsheets — although it’s not the best method, there are specific templates to consider.
This guide shares top sales tracking sheets and how to transition to using a CRM for improved sales tracking.
Table of Contents:
- The 7 Best Sales Tracking Spreadsheets
- 5 Problems Spreadsheet Sales Tracking Can Bring
- How To Track Sales Better Without Spreadsheets
- 8 Metrics To Better Track Sales Activity
- Best Practices For Tracking Sales in CRM
- Final Takeaway On Sales Tracking
 Automate All Your Communications With VipeCloud
VipeCloud is the only Automation tool your small business needs to
be the hero to your customers.
With Email, Texting, Social, Suites, Chat, Stories, Video Email & Sign Up Forms fully built-in, we provide you with the perfect platform to grow your business.
15 Day Free Trial – Get started risk free. No CC needed.
The 7 Best Sales Tracking Spreadsheets
1. Sales Tracker Template By Smartsheet
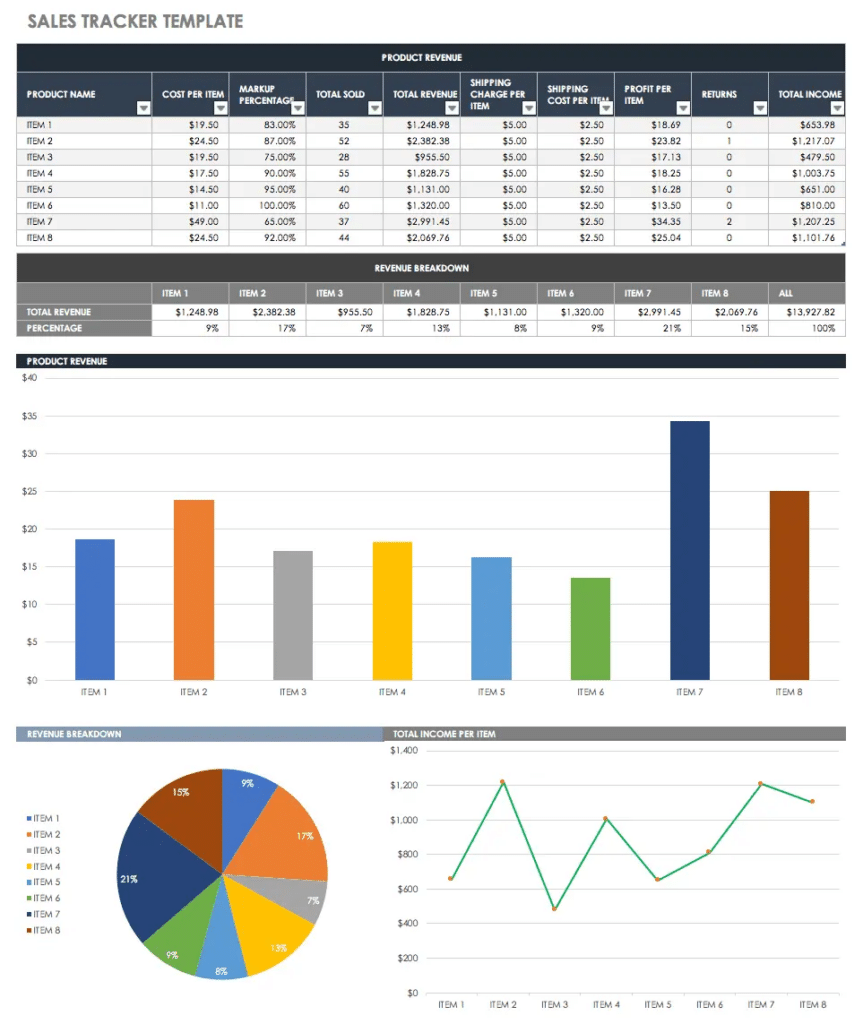
Template – Smartsheet – Sales Tracker Template
This sales tracking template focuses on online retail. You can track the products you’ve sold, their profits, and total revenue.
Your overhead costs, like shipping and returns, are also factored in for a more thorough breakdown. Data is represented visually through bar and pie graphs for easier analysis.
2. Sales Hacker Activity Scorecard
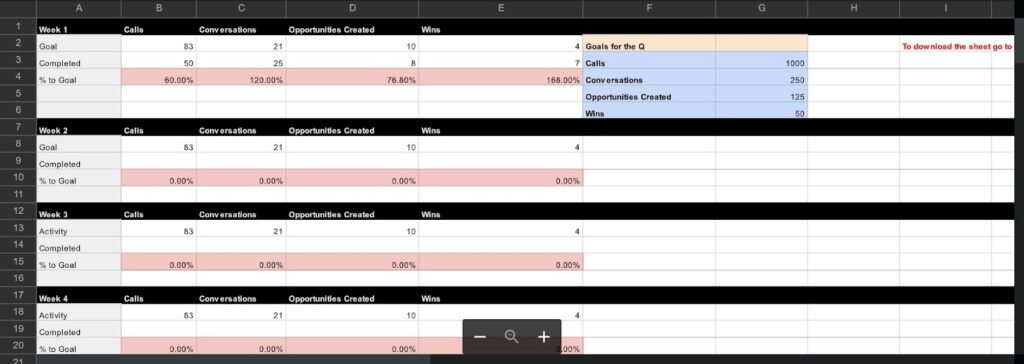
Template – Sales Hacker Activity Scorecard
This tracking sheet divides sales activity by weeks, and tracks calls, conversations, opportunities, and wins.
There’s a “goals” chart, allowing you to see how close each rep or SDR is to reaching their KPIs (“% to goal” measures this ratio).
3. Pipeline Velocity Analyzer
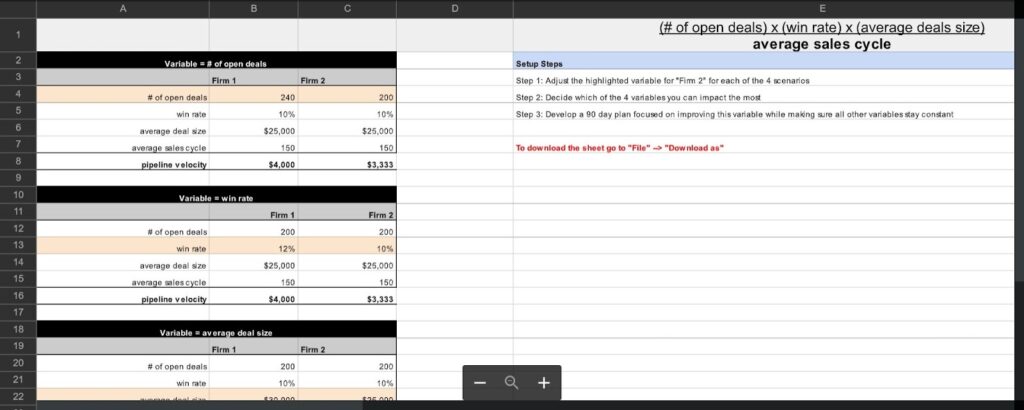
Template – Pipeline Velocity Analyzer
This sales tracking sheet calculates your pipeline (or “sales”) velocity by factoring in:
- Your number of deals
- Win rate
- Average deal size
- Average sales cycle
You can compare sales metrics of multiple locations, various teams, or individual reps in the customizable “Firm 1” or “Firm 2” section.
4. Microsoft Weekly Sales Activity Report

Template – Microsoft – Weekly sales tracking spreadsheet
This tracking sheet helps reps report their weekly numbers, including what they’ve sold based on the channels they’re using (for instance, social media, dialing, email, etc.)
5. Microsoft Online Sales Tracker

Template – Microsoft Online Sales Tracker
This template tracks sales made in an online product-based business.
You can automatically calculate each product’s total and percentage income, helping you easily find your best-selling products. With some customization, you can adapt this template to a service-based business.
6. Smartsheet Sales Funnel Spreadsheet
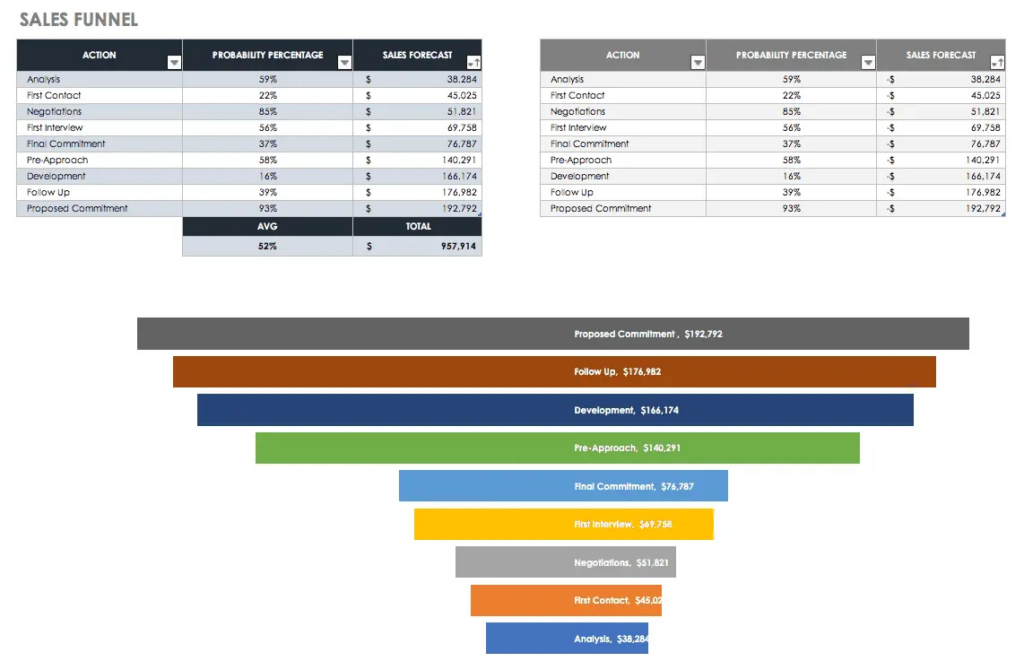
Template – Smartsheet – Sales funnel spreadsheet
This template gives a clear breakdown of your sales funnel and the value of each stage. The color-coded steps make it easy to visualize your sales process in action.
7. Fuzen Sales Activity Tracking
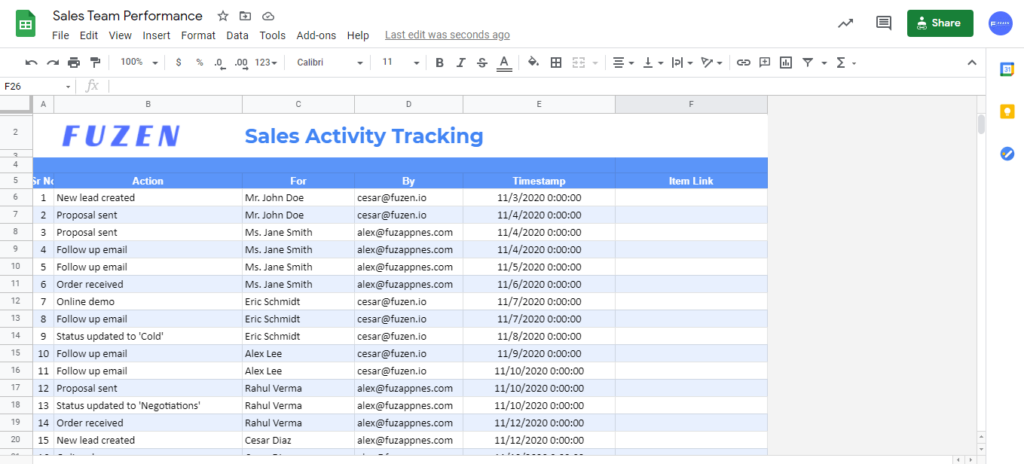
Template – Fuzen Sales Activity Tracking
This template showcases your sales reps’ activities down to a specific timestamp. Implementing this template helps make sales rep activity more transparent for sales leaders and managers who value consistent productivity.
5 Problems Spreadsheet Sales Tracking Can Bring
While low-cost and convenient, tracking sales using spreadsheets can create a few short and long-term problems. Here’s what you may find:
1. Difficult To Use And Unscalable
Spreadsheets can be hard to use if you don’t have thorough experience. When you also factor in multiple team members, you can see where using it effectively can fall short.
In addition, even if you train your team members on spreadsheets, they’ll be spending time learning an unscalable sales tool. By the time you look for a more scalable reporting avenue, you’ll have to teach your team the new platform.
2. Time-consuming With Manual Updates
It’s no secret that spreadsheets require quite a lot of manual entry. The time spent entering data and attempting to remember performance can slow down sales productivity. After all, 65% of an average sales rep’s time is already spent apart from selling.
3. Prone To Errors
Mistakes can pile up when using spreadsheets to track sales. For starters, reps can enter the wrong data, such as the incorrect number of emails sent on a given day.
There are also bigger mistakes if formulas aren’t set up correctly to calculate your metrics. The eventual downside of this is making leadership decisions based on inaccurate sales data.
4. Not Very Secure
Spreadsheets can be a security risk for storing sensitive information. After all, they often only require a login to access, and little mistakes like the wrong access permissions can leave your data open to anyone.
Security should be a priority, especially if you’re in an industry with regulations on storing customer or company data.
5. Conflicting Team Entry
If multiple people are using the same spreadsheet, keeping track of changes and avoiding conflicting data can be difficult.
The best way around this would be to implement data entry protocols for your team to follow.
How To Track Sales Better Without Spreadsheets
The best way to track sales without spreadsheets is by using a sales CRM. It has performance benefits for your team, with reports showing rep activity, opportunities, and more.
Sales CRM helps you dodge the 5 problems spreadsheets bring and gives real-time reports on what’s happening.
This live feedback makes Sales CRMs a better communication medium between reps and managers. But it doesn’t end there — CRM helps you:
- Manage team action items by using task management
- Send emails at scale with email automation and sequences
- Score your prospects based on how buyer-ready they are
VipeCloud is a CRM with sales capabilities, and many end–users applaud the ease of use. Here’s an example of how easy it is to get started with VipeCloud reports:
1. Start with a free trial of VipeCloud and create an account
2. Log in and navigate to your sales team overview by clicking “reports” on the sidebar
3. Track critical sales metrics like item counts, email opportunities by stage, tasks by type, sales velocity, and more.
If you want to learn how to implement CRM in your business as an alternative to using spreadsheets for sales tracking, check out our guide on CRM implementation.
8 Metrics To Better Track Sales Activity
Here are 8 sales CRM metrics to closely monitor for an improved sales cycle year-round.
1. Active Users
What It Does
Active users give you insights into your team’s performance and CRM activity. You’ll find sub-metrics such as:
- Contacts engaged
- Accounts engaged
- Contacts added
- Emails sent
- Tasks completed
How To Use It
You can use this to track your sales team’s day-to-day activities accurately. Instead of having them try to remember and manually enter their performance, CRM streamlines the tracking for you.
Active users also help you gauge your CRM adoption rate. The more your team uses CRM effectively, the higher the chances of continued sales efficiency and transparency.
2. Item Counts
What It Does
This tracks the number of contacts, accounts, opportunities, open tasks, and completed tasks each rep has.
How To Use It
Item counts can help you better track rep activity and especially overload. If you’re finding a few reps that are overworked with opportunities, you can adjust your lead distribution strategy to balance out how deals get handled.
Item counts can also tell a rep’s productivity by showing you how many open tasks they have. Having lots of available tasks could be a symptom of low productivity.
3. Marketing Effectiveness
What It Does
Marketing effectiveness is the measure of your outbound team’s success. It tracks the number of emails sent, open rates, and click-through rates.
How To Use It
You can track the number of emails your SDRs send to get you more leads and meetings.
If you know how many emails it takes to get 1 meeting, then you can reverse engineer steps to success by setting that as daily email KPIs.
4. Opportunities By Stage
What It Does
This is an overview of rep opportunities at different stages. On VipeCloud, this feature allows you to toggle between your various pipelines.
How To Use It
Sales rep opportunities come with a deal amount, giving you insight into which deals to prioritize.
For instance, if a high-value deal is in the “proposal stage,” you can actively coach that rep on following up and closing the deal effectively.
You can use opportunities by stage to sell AND manage your accounts. Create a client management pipeline and switch to it when you want to see how service delivery is going. (You’ll see which account managers are responsible for which clients.)
5. Tasks By Type
What It Does
This lets you track the number of tasks completed by your team. It comes with established task categories — however, you can set custom tasks such as text message tasks for instance.
How To Use It
Like active users, you can use tasks by type to gauge rep CRM adoption and productivity. More action items getting done can help shorten the sales cycle and contribute to better sales velocity.
6. Sales Velocity
What It Does
Sales velocity tracks the speed at which your organization is making revenue. Sales velocity is based on the number of opportunities in your pipeline, the average opportunity size, the win rate, and the average sales cycle.
How To Use It
Sales velocity is a culmination of your opportunities, opportunity size, win rate, and average sales cycle. This means you can use sales velocity to gauge the health of these critical metrics.
- Ideally, you want as many opportunities as possible
- The average opportunity size should be as high as possible
- Your win rate should be as high as possible
- Your average sales cycle should be as few days as possible
7. Recurring Revenue Pipeline
What It Does
This metric helps project revenue based on your product or service with a monthly recurring cost. If you also factor in CLV, you’ll know how much an average buyer is worth to your business.
How To Use It
You can use your recurring revenue pipeline to forecast revenue across your clients. Revenue predictability gets even easier if your service requires clients to sign-up on a multi-month contract.
8. Sales Leaderboard
What It Does
The sales leaderboard ranks your most successful reps based on your set KPIs. This is a more streamlined version of the spreadsheet leaderboard.
Why?
It’s because it factors in all your CRM data without the potential errors spreadsheets can bring.
How To Use It
You can use the sales leaderboard to identify your top-performing sales reps. This also opens the door for healthy rep competition, especially if you implement performance incentives.
A ranking system is proven to boost sales motivation and inspire more confidence in your top-performing reps.
6 Best Practices For Tracking Sales In CRM
Here 6 essential practices when it comes to tracking sales in your CRM:
1. Monitor sales numbers daily and weekly.
2. Write contextual notes about your opportunities.
3. Use sales data to find the strengths and weaknesses of reps.
4. Keep pipeline opportunity cards up-to-date.
5. Use sales stage conversion rates to find bottlenecks .
6. Focus on core KPIs.
Final Takeaway On Sales Tracking
While sales spreadsheets are easy to implement for tracking, they can come with many drawbacks.
Today’s successful business is leveraging CRM to streamline sales processes, including their reports.
If you’re looking for the best alternatives to spreadsheets, try the best small business sales CRM — VipeCloud.
Request a demo today, and we’ll show how you can adapt it to your business.
If you’re ready to try VipeCloud on a 15-day free trial, you can sign-up by navigating here.


Leave a Comment